In some states, road safety is going in reverse
Motointegrator reports that traffic fatalities in the U.S. remain alarmingly high post-pandemic, with 40 states seeing increased death rates, and a study it conducted with DataPulse reveals the states struggling the most and explores strategies to improve road safety.
After a driving slump triggered by the global pandemic, Americans are back behind the steering wheel. However, one trend continues to linger: high rates of traffic fatalities.
Nearly 41,000 people died from motor vehicle crashes in 2023. While that is slightly reduced from the two years prior, it is still about 4,000 more people than in the years before the pandemic. Even when those fatalities are adjusted for changes in travel habits, the rate of deaths per mile was 11% higher in 2023 than during the 2017-2019 period, according to an analysis of U.S. government statistics conducted by the online shop for auto parts Motointegrator and the data research firm DataPulse. The study also found that 40 out of the 50 states experienced a higher fatality rate in 2023 than before the pandemic.
Here is a close look at how the U.S. got here, which states are struggling the most, and how to get the problem under control.
This time, it's different
The pandemic's adverse impact on America's road safety is as alarming as it is surprising. Historically, less driving resulted in fewer fatalities. Consider what happened during the years of the Great Recession: Americans traveled 3.03 trillion miles on U.S. roads in 2007, the year the recession started, but by 2009, they had reduced their driving by 73 billion miles. As the chart below shows, the number of fatalities also fell during that stretch. When mileage started ticking back up in 2012, the number of deaths crept back up as well.
Less driving, but more road fatalities
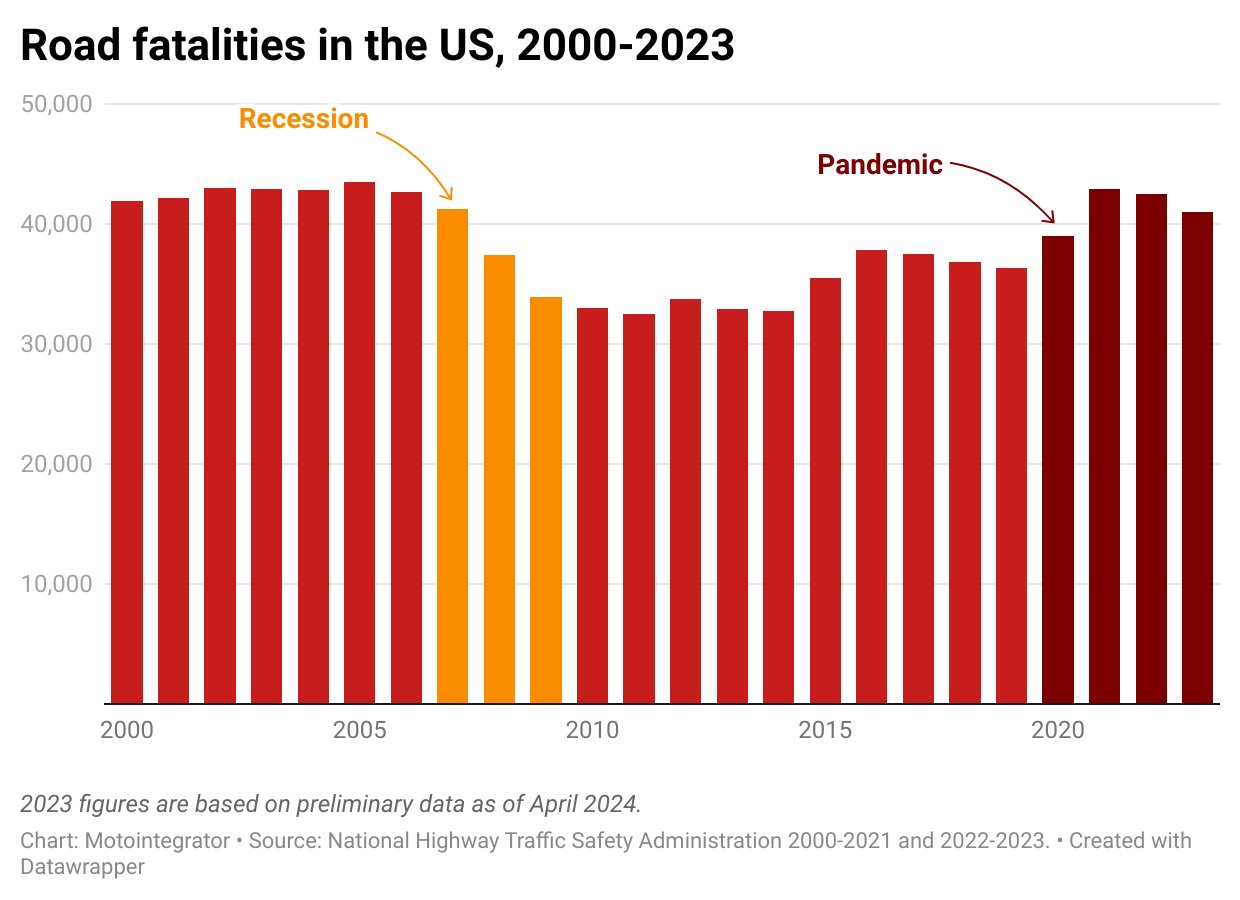
Road travel was still rising gradually leading into the pandemic, from 3.21 trillion miles in 2017 to 3.26 trillion in 2019, but fatalities dropped during that span, falling to 36,355 deaths in 2019.
Statistics peaked during the pandemic
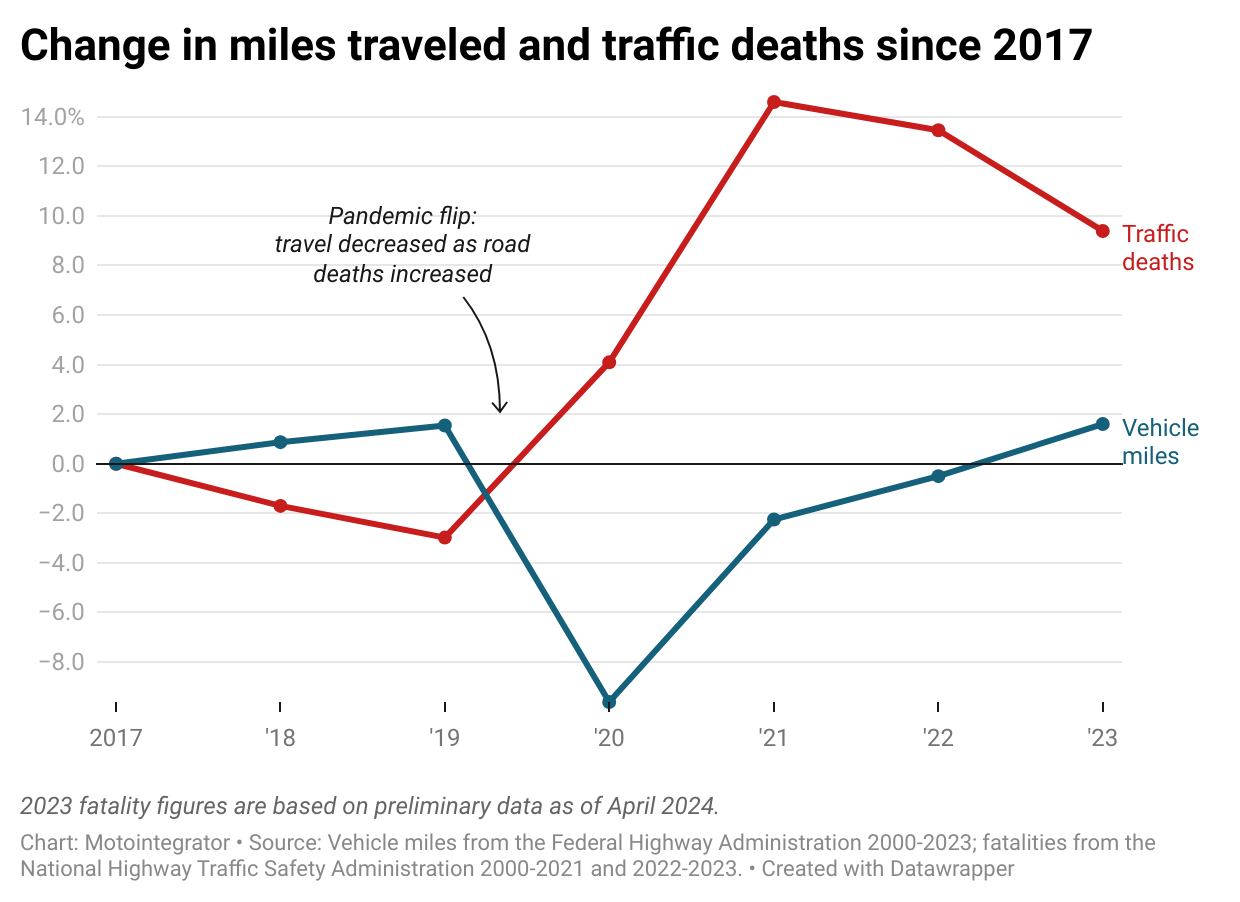
The pandemic completely flipped that script. As the above chart shows, driving miles plummeted, and fatalities shot up. A total of 2,652 more people died in 2020 compared with 2019. In 2021 the death toll increased again by 3,932 people.
In 2023, Americans completely returned to their old driving habits. Their vehicles traveled 3.26 trillion miles — the same distance as in 2019. However, the number of U.S. road fatalities has not returned to normal. It is still much higher than pre-pandemic years.
Falling further behind
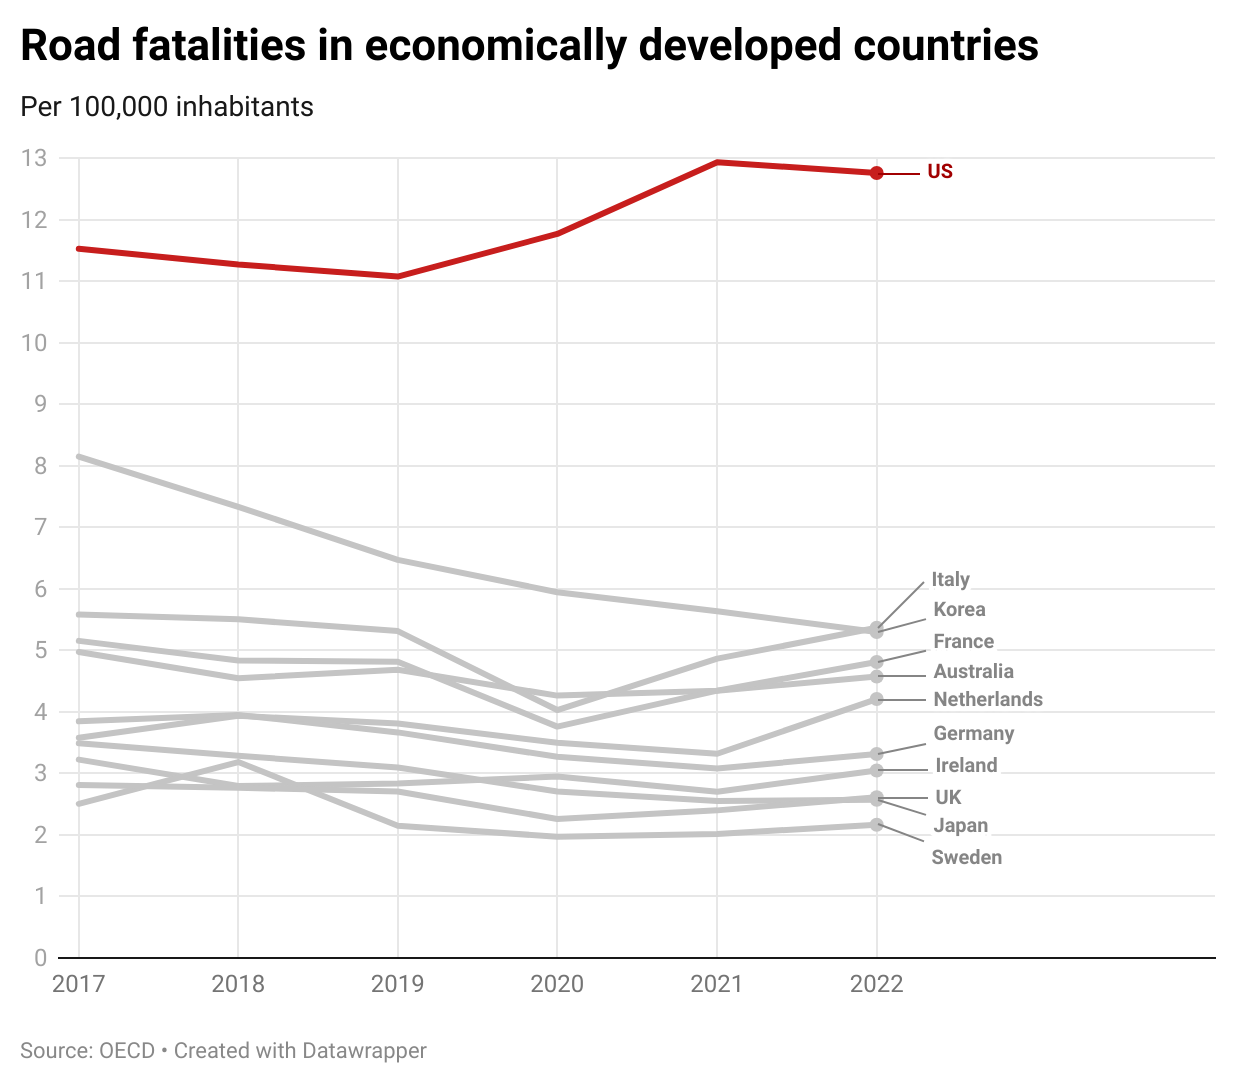
In recent decades, many democratic nations have made impressive strides in reducing traffic fatalities. However, the U.S. lagged behind, creating a gap in road safety. In a 2020 report, the Department of Transportation called road safety a "public health crisis" and made a case for the nation to follow other countries that had adopted road safety initiatives.
When the pandemic swept the globe, road fatalities dropped in many countries, including France, Germany, and Korea. Because pandemic-era fatalities rose in the U.S. and fell elsewhere, the gap between the U.S. and its peer countries widened.
Mapping the worst roads in the U.S.
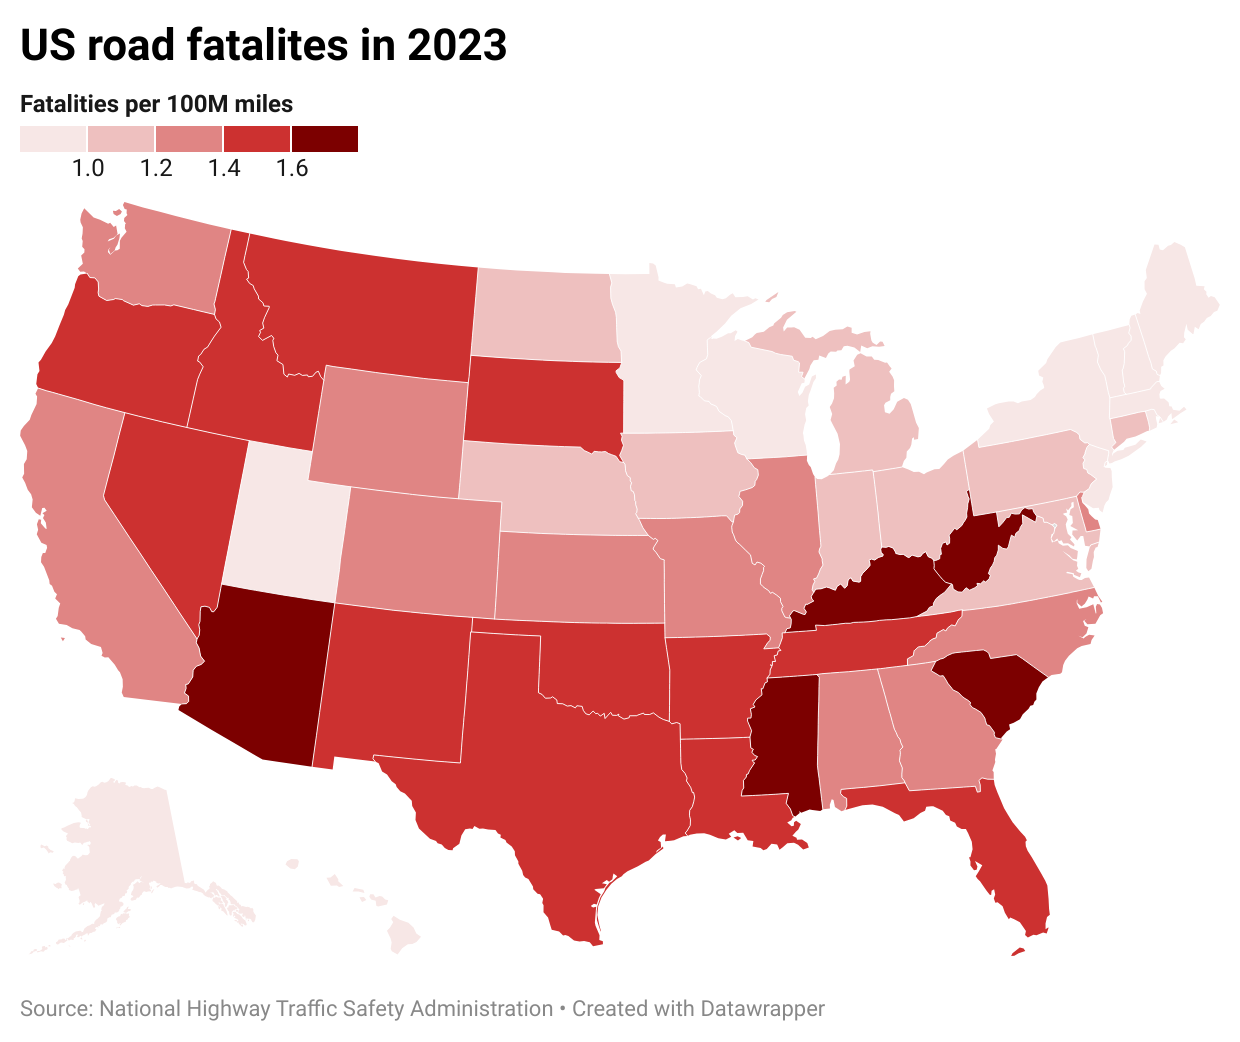
In 2023, the U.S. had 1.26 road fatalities per 100 million vehicle miles. However, fatality rates vary by region and state, ranging from 0.56 in Massachusetts to 1.76 in Mississippi. The map above shows fatality rates across the country.
Highest fatality rates
- Mississippi had 1.76 road fatalities for every 100 million miles driven on its roads. This is the worst rate in the country and 40% higher than the national rate of 1.26. In 2023, 715 people died in road collisions in Mississippi.
- South Carolina, which had the highest rate in 2022, dropped to second highest in 2023. It had 1.7 road fatalities for every 100 million miles, or 1,028 fatalities that year.
- Arizona, nearly tied with South Carolina, had 1.69 road fatalities for every 100 million miles. There were 1,315 deaths in 2023.
Lowest fatality rates
- Massachusetts, with the lowest fatality rate in the country, had 0.56 deaths for every 100 million miles driven on its roads. This is less than half the national rate of 1.26. About 350 people died in road collisions last year.
- Minnesota had 0.71 road fatalities for every 100 million miles. The number of fatalities in 2023 totaled 418 people.
- New Jersey had the third lowest rate, with 0.78 deaths per 100 million miles. There were 615 deaths last year.
The pandemic shakeup
The pandemic shakeup has been uneven across the country. According to calculations of 2023 government data by Motointegrator and DataPulse, only 10 states have fatality rates below pre-pandemic norms. Meanwhile, 40 states still have higher fatality rates than before the pandemic.
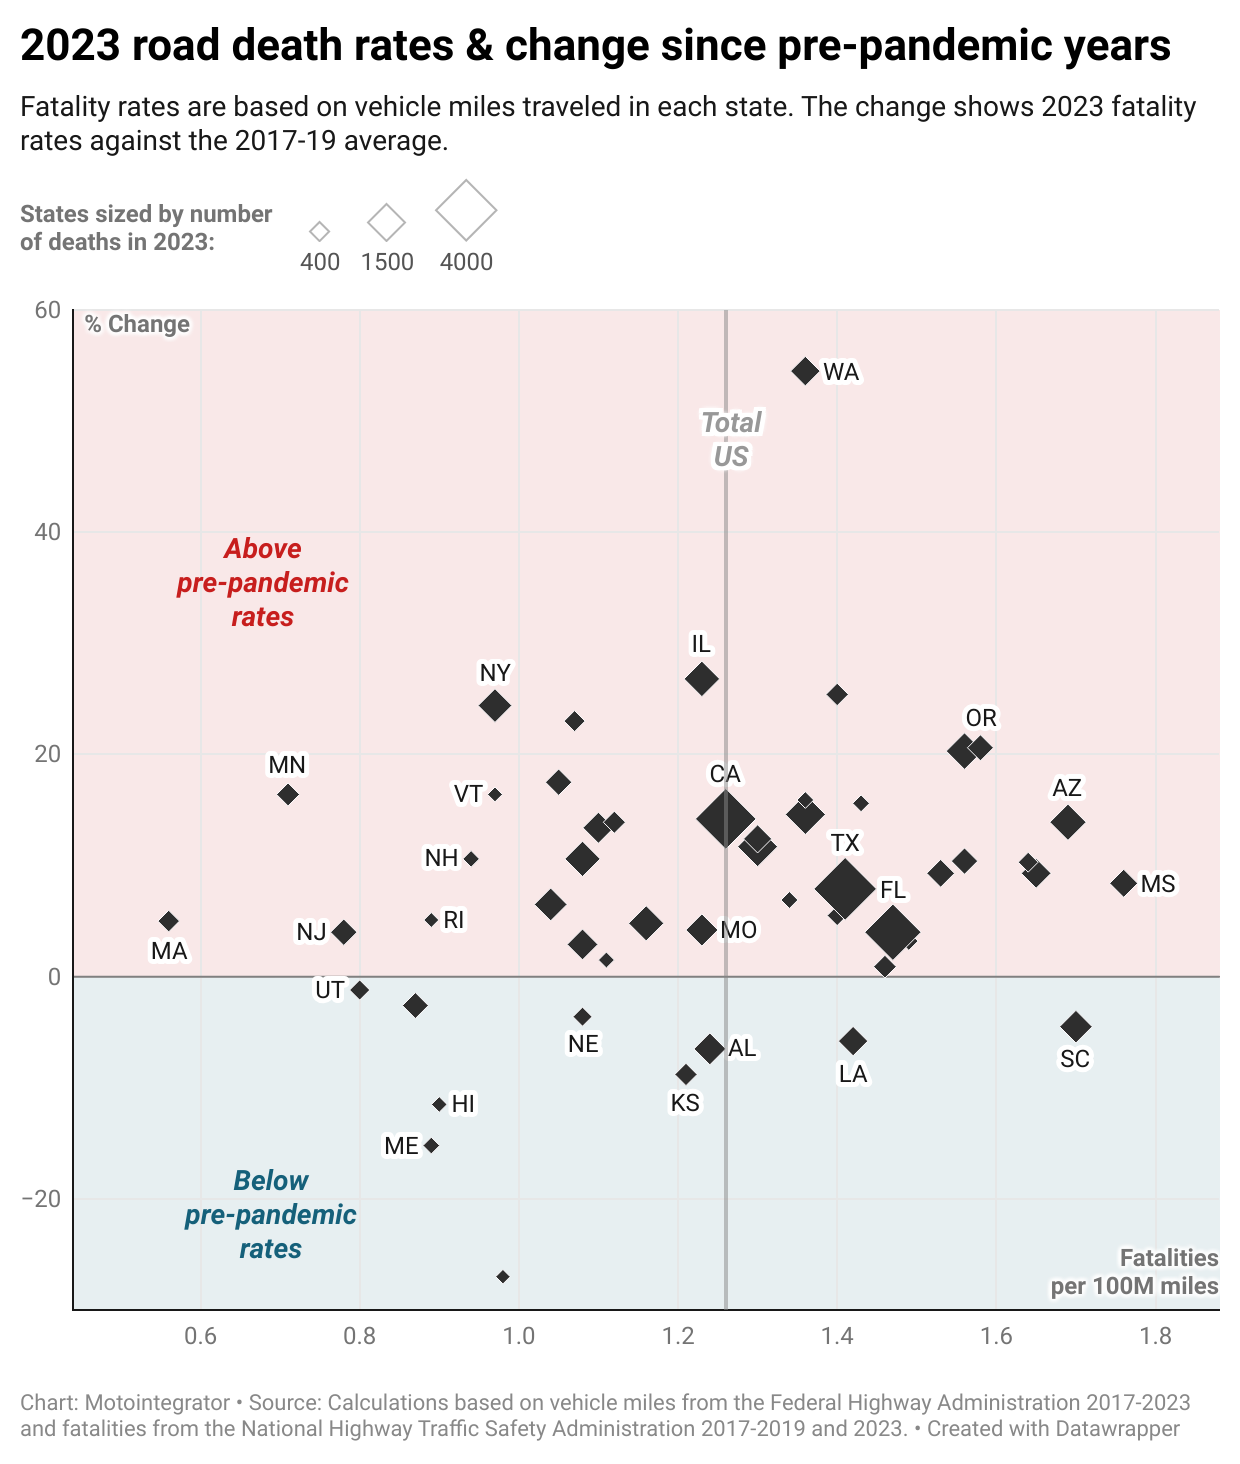
The matrix below shows which states are trending above and below their pre-pandemic fatality rates. The states in red had a higher rate of deaths in 2023 compared to the 2017-2019 average. The states in blue had a lower rate. (Fatalities are adjusted for driving trends in each state. The rate is based on deaths per 100 million vehicle miles.) The matrix also shows how the states currently stack up against each other, going from lower fatality rates (left) to high fatality rates (right).
Above pre-pandemic norms
- Washington has had a major reversal in road safety. Before the pandemic, Washington had the 10th best record in the country, based on a 3-year average fatality rate. Today, it ranks 31st in the country, at 1.36 deaths per 100 million miles. This increase, a 55% jump, is the largest swing of any state. More than 800 people died in road crashes last year, up from an average of 547 before the pandemic.
- Illinois has a rate of 1.23 deaths per 100 million miles. While this is in line with the U.S. national rate, it is a poor performance for the state, which was comfortably below the national rate during the pre-pandemic years. The state's fatality rate is now 27% higher, and 1,255 people died on its roads in 2023.
- Nevada is experiencing fatality rates that are 25% higher than before the pandemic. In 2023, 389 people died, which translates to 1.4 fatalities for every 100 million vehicle miles.
Below pre-pandemic norms
- Alaska had an average of 1.34 deaths per 100 million miles before the pandemic. That rate has dropped 27% to 0.98. That is the largest drop in the country. Alaska only had 57 road fatalities in 2023. It is hard to say if Alaska's improvement will stick because its fatality rate has fluctuated quite a bit during the pandemic years. In 2022, for instance, its rate was 1.5, and more than 80 people died.
- Maine has had the second-largest drop from pre-pandemic levels — a 15% decrease, from 1.05 to 0.89 fatalities per 100 million miles. A total of 135 people died in 2023. But like Alaska, Maine's fatality numbers have been up and down without a clear trend. In 2022 its rate stood at 1.24.
- Hawaii has consistently trended below the U.S. fatality rate, even before the pandemic. In 2023 the rate stood at 0.9 deaths per 100 million miles — a decrease of about 12% from pre-pandemic norms — and totaled 94 people.
Where to go from here
To figure out how to bring fatality rates back down to pre-pandemic levels, it helps to understand why quiet roads became so deadly in the first place. Many reports on road fatalities highlight the usual culprits: distracted driving, speeding, seat belt misuse, and intoxication. The pandemic appears to have exacerbated many of those bad habits.
The National Highway Traffic Safety Administration, run by the Department of Transportation, reported in 2021 that "drivers who remained on the roads [during lockdowns] engaged in more risky behavior, including speeding, failing to wear seat belts, and driving under the influence of drugs or alcohol. Traffic data indicates that average speeds increased throughout [2020], and examples of extreme speeds became more common, while the evidence also shows that fewer people involved in crashes used their seat belts."
Other factors, like the prevalence of large SUVs — a distinctly American trait — and lack of sidewalks on suburban roads, have compounded these trends, experts have noted.
With so many variables, there is no silver bullet to address the crisis. However, the Department of Transportation kicked off an ambitious plan in early 2022 known as the National Roadway Safety Strategy to take a multifaceted approach to make roads, vehicles, and drivers safer. The initiatives are rolling out through new policies, law enforcement, and infrastructure investment. Technology may also play a role, including the development of intelligent speed assistance systems, which some state legislatures are considering making mandatory.
As the nation moves forward, a collective effort from policymakers, communities, and drivers will be crucial to reversing the alarming trend of unacceptably high road fatalities.
This story originally appeared on Motointegrator, was produced in collaboration with DataPulse, and reviewed and distributed by Stacker Media.


Comments